-
Ganttis a cool way to visualize task. -
Most of time I care about write out my task, quickly jump to them and check them when their are done. That all. But anyone want to see cool things. Good, just look at the visualize, it is generation using mermaid.
-
I want to using more mature library. But how on earth noone design an open source Javascript library to generate Gantt chart.
How to use it.
-
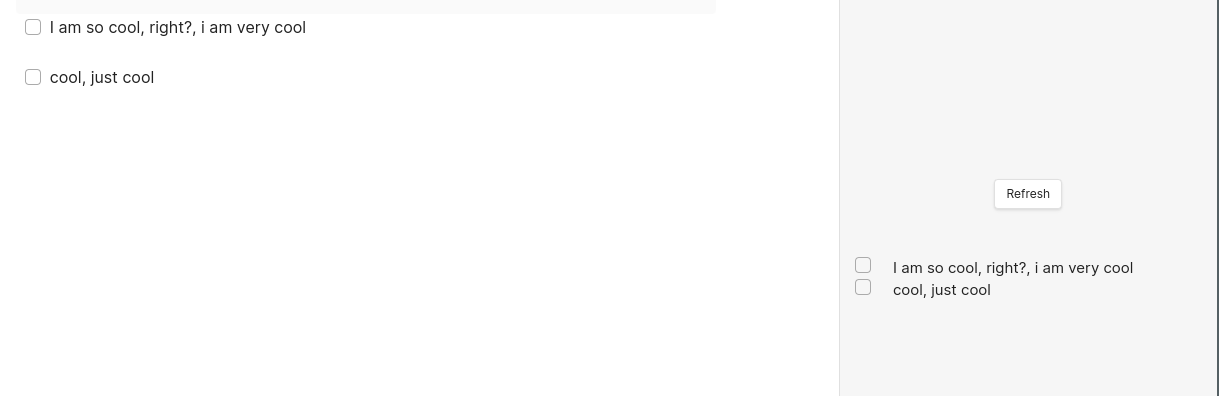
Just write your task, any valid task need to be at least a list item + a checkbox.
-
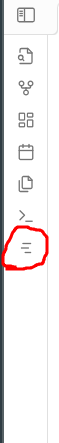
There is a button, click on it. A sidebar appear in the right. We have “magic” appear here. That all, this is the simply thing I want to do with this plugin.
- But for someone want to visualize task. Add some time range to your task.
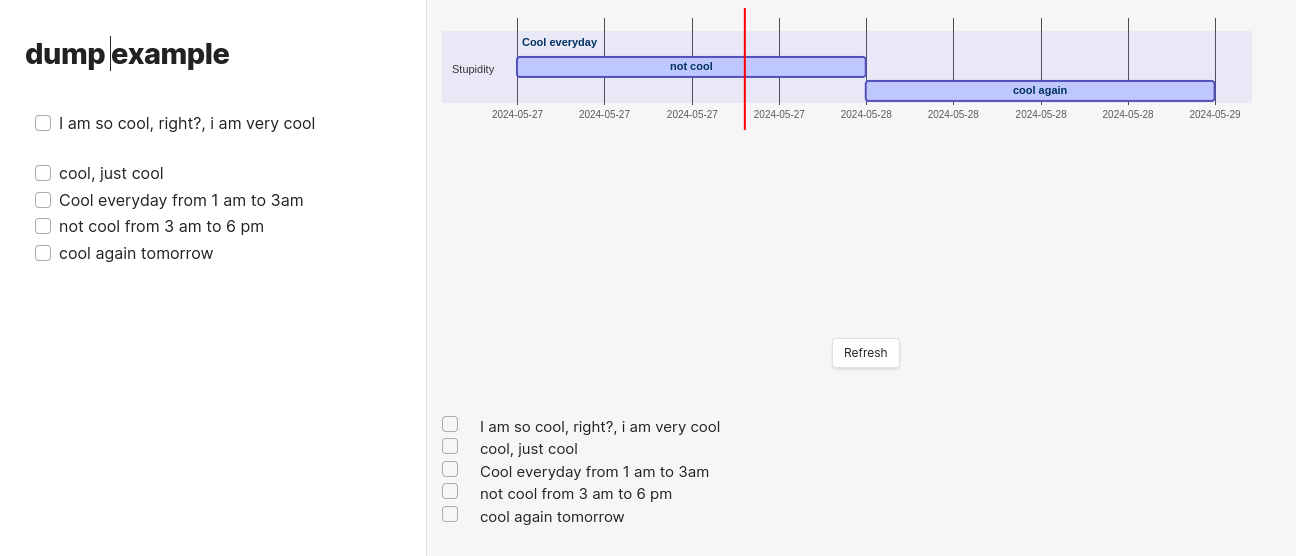 - Mermaid visualize look ugly and bold, that all. But that is the best I can find. And at least it is fast and lightweight.
Tip
Only track a valid task (line with checkbox) which have part of string that can interpret as time/time range
Smart Gantt is not perfect for natural language processing:
Cannot parse text with only a year like “2024”, so please write your sentence a bit clearly
Time (hours, minutes) of day must stay after date. Example Sat Aug 17 2024 9 AM or Sat Aug 17 2013 18:40:39 GMT+0900 or 2014-11-30T08:15:30-05:30. But 9 AM April/11/2024 will be parsed as 2 different points of time.
Relative time like - today, tomorrow, yesterday, last friday, 5 hours from now - will work in theory, but it is not useful at all. Because every time you refresh the plot will parse from your current point of time